Exploring Code Performance Testing in C# with BenchmarkDotNet

There have been many times where, while coding, I was facing the dilemma of choosing the appropriate LINQ method, or questioning the efficiency and speed of my code. During those moments, when I didn’t want to just flip a coin or make random choices, I turned to performance testing. In this article, we will explore how we can test the performance of our C# code by using a library called BenchmarkDotNet!
Introduction
BenchmarkDotNet is a popular open-source library that, as stated in the repo’s README.md, helps us to transform methods into benchmarks, track their performance, and share reproducible measurement experiments. Using BenchmarkDotNet feels similar to writing unit tests. It’s very important to note that the library only works with console apps. Finally, we can visualize the results in the terminal where the benchmark ran or in user-friendly formats such as markdown, HTML and CSV. We will explore examples of there formats later in the article.
The code of the examples shown in the article can be found here.
Installation
First and foremost, we need to create a console application to run our benchmarks. We can create a new one using the dotnet CLI in the terminal :
1
 dotnet new console -n Benchmarks
Next, open the newly created project in your preferred IDE (I’ll be using VS Code). Install the BenchmarkDotNet NuGet package by including the following line in the .csproj file (Version 0.13.5 which is the latest version when this article was written) :
1
2
3
  <ItemGroup>
    <PackageReference Include="BenchmarkDotNet" Version="0.13.5" />
  </ItemGroup>
Alternatively, we can run
dotnet add package BenchmarkDotNetin the terminal.
With that, we are ready to start writing our benchmarks!
Setup
Lets create the methods that we want to benchmark. The example is going to be a comparison between two methods that return the sum of all the integers in an array.
1
2
3
4
5
6
7
8
9
10
11
12
13
14
15
16
17
18
19
20
21
22
23
24
25
using BenchmarkDotNet.Attributes;

namespace Benchmarks;

public class SumBenchmark
{
    readonly int[] arr = new int[] { 1, 2, 3, 6, 7, 8 };

    [Benchmark]
    public int SumWithForLoop()
    {
        int sum = 0;
        for (int i = 0; i < arr.Length; i++)
        {
            sum += arr[i];
        }
        return sum;
    }

    [Benchmark]
    public int SumWithLinqSum()
    {
        return arr.Sum();
    }
}
All we have to do now to run our benchmarks and print the results to the console is to add BenchmarkRunner.Run<SumBenchmark>(); to Program.cs.
Our Program.cs should look something like this now:
1
2
3
4
using BenchmarkDotNet.Running;
using Benchmarks;

BenchmarkRunner.Run<SumBenchmark>();
We should make sure that the project is build and runs in Release mode, so lets go ahead and do that.
1
2
3
dotnet build -c Release

dotnet run -c Release
That was it, now we should be able to examine the results. We can find them in the BenchmarkDotNet.Artifacts/results folder.
Results
The results are being presented in three different user-friendly forms, markdown, HTML and CSV, as mentioned before. Lets see the results of our example :
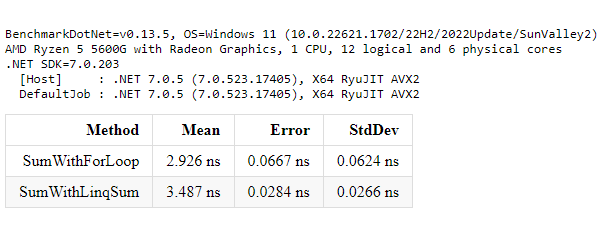
- Markdown
 Results in Markdown
- HTML
 Results in HTML
- CSV
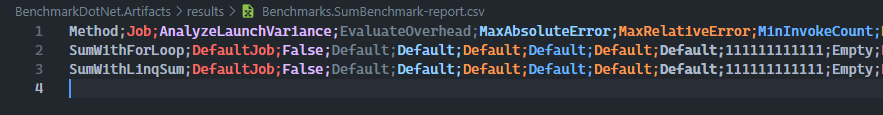 Results in CSV
In the results we can see, for now, the columns Method Mean Error & StdDev. Lets explore what these terms actually mean.
- Method. The name of the method being benchmarked.
- Mean. By definition it’s the sum of a collection of numbers divided by the count of numbers in the collection. In the context of benchmarking,
Meanrefers to the average execution time of a method over multiple iterations. - Error. It’s a metric to let us understand the differences between each iteration. A smaller
Errormeans the measurements were more consistent and closer to each other. - StdDev (Standard Deviation). It measures the variation from the
Mean.
Judging from these results, we can see that the SumWithForLoop method performs better than the SumWithLinqSum method on the dataset we provided. We can have additional metrics by adding configurations, but we will explore these later on this article.
Global Setup and Global Cleanup
In our example, we have hardcoded the values in the array. What if we wanted to create data for a test database and when we are done with benchmarking, to cleanup this database? We wouldn’t want to measure the logic of the data creation and retrieval, or database cleanup together with the other two functions. That’s where GlobalSetup and GlobalCleanup attributes come into play.
Global Setup
We can setup any method as a setup method by adding the GlobalSetup attribute. This method will be executed once per benchmark method before the execution of the benchmarks. In our case we would move the creation of the array into the method decorated with the attibute.
1
2
3
4
5
6
7
8
9
    [GlobalSetup]
    public void Setup()
    {
        arr = new int[6];
        for (var i = 0; i < arr.Length; i++)
        {
            arr[i] = Random.Shared.Next(1, 10);
        }
    }
Global Cleanup
The same goes for Global Cleanup. We just have to decorate the method that is cleaning up our resources with the attribute GlobalCleanup. This method will be executed once per benchmark method after the execution of the benchmarks.
1
2
3
4
5
6
    [GlobalCleanup]
    public void Cleanup()
    {
	    // cleanup logic
        arr = Array.Empty<int>();
    }
It is worth mentioning that there are two more similar attributes IterationSetup and IterationCleanup that as their name suggests, they run before and after each benchmark method iteration.
Parameters
Parameters, in BenchmarkDotNet, add a lot of flexibility into our benchmarks, allowing us to create benchmarks that adapt to different input scenarios and test a range of use cases. When we introduce parameters, the benchmarking process is repeated for each combination of parameter values therefore, it may show separate results for each parameter combination. Lets try to adjust our benchmarks to use parameters.
1
2
3
4
5
6
7
8
9
10
11
12
    [Params(5, 10, 25)]
    public int ArraySize { get; set; }

    [GlobalSetup]
    public void Setup()
    {
        arr = new int[ArraySize];
        for (var i = 0; i < arr.Length; i++)
        {
            arr[i] = Random.Shared.Next(1, 10);
        }
    }
The results after the parameter addition:
| Method | ArraySize | Mean | Error | StdDev |
|---|---|---|---|---|
| SumWithForLoop | 5 | 2.165 ns | 0.0348 ns | 0.0326 ns |
| SumWithLinqSum | 5 | 3.222 ns | 0.0097 ns | 0.0081 ns |
| SumWithForLoop | 10 | 4.713 ns | 0.0038 ns | 0.0032 ns |
| SumWithLinqSum | 10 | 4.580 ns | 0.1015 ns | 0.1456 ns |
| SumWithForLoop | 25 | 12.387 ns | 0.1456 ns | 0.1290 ns |
| SumWithLinqSum | 25 | 9.102 ns | 0.1543 ns | 0.1652 ns |
Notice the new column that appeared in our results,
ArraySize.
Baselines
Baselines help us understand how well our code performs by giving us a starting point to measure against. They are like a friendly guide that tells us if our code is getting faster or slower. We can have benchmark baselines and job baselines. Lets set the SumWithForLoop method as a baseline, and lets create another variation of the Sum method with a while loop implementation.
1
2
3
4
5
6
7
8
9
10
11
12
13
14
15
16
17
18
19
20
21
22
23
24
25
26
27
28
29
    [Benchmark(Baseline = true)]
    public int SumWithForLoop()
    {
        int sum = 0;
        for (int i = 0; i < arr.Length; i++)
        {
            sum += arr[i];
        }
        return sum;
    }

    [Benchmark]
    public int SumWithWhileLoop()
    {
        int sum = 0;
        int counter = 0;
        while (counter < arr.Length)
        {
            sum += arr[counter];
            counter++;
        }
        return sum;
    }

    [Benchmark]
    public int SumWithLinqSum()
    {
        return arr.Sum();
    }
In the summary table we should see two additional columns Ratio and RatioSD.
| Method | ArraySize | Mean | Error | StdDev | Ratio | RatioSD |
|---|---|---|---|---|---|---|
| SumWithForLoop | 5 | 2.146 ns | 0.0363 ns | 0.0339 ns | 1.00 | 0.00 |
| SumWithWhileLoop | 5 | 2.261 ns | 0.0727 ns | 0.0714 ns | 1.05 | 0.05 |
| SumWithLinqSum | 5 | 3.353 ns | 0.0932 ns | 0.1244 ns | 1.57 | 0.07 |
| SumWithForLoop | 10 | 4.870 ns | 0.0909 ns | 0.0759 ns | 1.00 | 0.00 |
| SumWithWhileLoop | 10 | 5.274 ns | 0.1219 ns | 0.1403 ns | 1.07 | 0.04 |
| SumWithLinqSum | 10 | 4.588 ns | 0.0966 ns | 0.1385 ns | 0.95 | 0.03 |
| SumWithForLoop | 25 | 12.277 ns | 0.1340 ns | 0.1046 ns | 1.00 | 0.00 |
| SumWithWhileLoop | 25 | 12.701 ns | 0.2838 ns | 0.2915 ns | 1.04 | 0.02 |
| SumWithLinqSum | 25 | 9.030 ns | 0.1183 ns | 0.1106 ns | 0.73 | 0.01 |
Since the SumWithForLoop method is the baseline, the Ratio is 1 and RatioSD 0. But what do these values mean for the other methods? Ratio is calculated by dividing each measurement of a benchmark to the equivalent measurement of the baseline and then calculating the Mean of all these values. So in our example, the SumWithWhileLoop method is slower than the SumWithForLoop by 0.05 times. RatioSD, which means Ratio Standard Deviation, represents the consistency of the ratios between two measurements. If the RatioSD is small, it means the comparison is stable, while a high RatioSD means there’s more variation in the comparison.
Configurations
BenchmarkDotNet gives us the option to configure the whole benchmarking process to cover everything we might need, from Jobs and Diagnosers, to Loggers and Exporters. Lets go through some of my most used ones!
Diagnosers
Diagnosers play a huge role within BenchmarkDotNet. They provide additional statistics and performance analysis. Whether we need to track memory allocation, monitor hardware performance counters to capture event tracing data, Diagnosers have us covered.
Lets look at an example on the usage. In the example we were using before, lets add a MemoryDiagnoser , which measures the number of allocated bytes and the GC frequency, and the HardwareCounters, which are a set of special-purpose registers built into modern microprocessors to store the counts of hardware-related activities within computer systems. We can do that by adding an attribute for each diagnoser:
1
2
3
4
5
[MemoryDiagnoser]
[HardwareCounters(
        HardwareCounter.BranchMispredictions,
        HardwareCounter.BranchInstructions)]
public class SumBenchmark
The final results now include the new columns we specified
| Method | ArraySize | Mean | Error | StdDev | BranchInstructions/Op | BranchMispredictions/Op | Allocated |
|---|---|---|---|---|---|---|---|
| SumWithForLoop | 5 | 3.239 ns | 0.0617 ns | 0.0547 ns | 11 | 0 | - |
| SumWithLinqSum | 5 | 6.598 ns | 0.0836 ns | 0.0741 ns | 17 | 0 | - |
| SumWithForLoop | 10 | 7.828 ns | 0.2991 ns | 0.8773 ns | 21 | 0 | - |
| SumWithLinqSum | 10 | 8.288 ns | 0.1952 ns | 0.3097 ns | 27 | 0 | - |
| SumWithForLoop | 25 | 17.850 ns | 0.3752 ns | 0.5381 ns | 50 | 0 | - |
| SumWithLinqSum | 25 | 14.094 ns | 0.2121 ns | 0.1656 ns | 56 | 0 | - |
Jobs
Jobs refer to the configuration options that define the target environment for benchmarking. They allow us to specify various parameters related to the runtime, platform, and launch settings, enabling us to simulate different execution scenarios during benchmark runs. With jobs, we can control factors such as the runtime version, runtime iteration mode (single or multithreaded), target platform (x86 or x64), and launch count and warm-up count, among others. By defining different jobs, we can explore how our code performs under various conditions and environments. Lets see an example :
1
2
3
[SimpleJob(BenchmarkDotNet.Jobs.RuntimeMoniker.Net70, baseline: true)]
[SimpleJob(BenchmarkDotNet.Jobs.RuntimeMoniker.Net60)]
public class SumBenchmark
In the above code, we have added the baseline: true parameter to the SimpleJob attribute. This parameter designates the .NET 7.0 job as the baseline job, indicating that it is the reference against which other jobs will be compared. This helps in benchmarking and comparing performance across different frameworks or runtime versions.
Then we can run the benchmarks in multiple frameworks by specifying the target framework moniker names via --runtimes|-r console argument, in our case :
1
dotnet run -c Release -f net7.0 --runtimes net6.0 net7.0
You can read more about targeting multiple frameworks here.
Conclusion
In conclusion, by leveraging BenchmarkDotNet, we can make informed decisions about our code’s performance, identify bottlenecks, and optimize our implementations effectively. With performance testing as a valuable tool in our development toolkit, we can ensure that our code performs optimally and meets the requirements of demanding applications.
You can read further about BenchmarkDotNet here : Official documentation GitHub repo Adam Sitnik’s blog Adam is one of the maintainers of the library and his blogs are pretty cool. Wojciech Nagórski’s blog Wojciech is a contributor to BenchmarkDotNet and has a lot of cool articles about the library as well!